Set & era context
Grading economics
GRADEPopulation by grader
Hand-curated approximations of public pop data as of 2026-05-04 — refreshed via partner integration.
Price history
Analysis
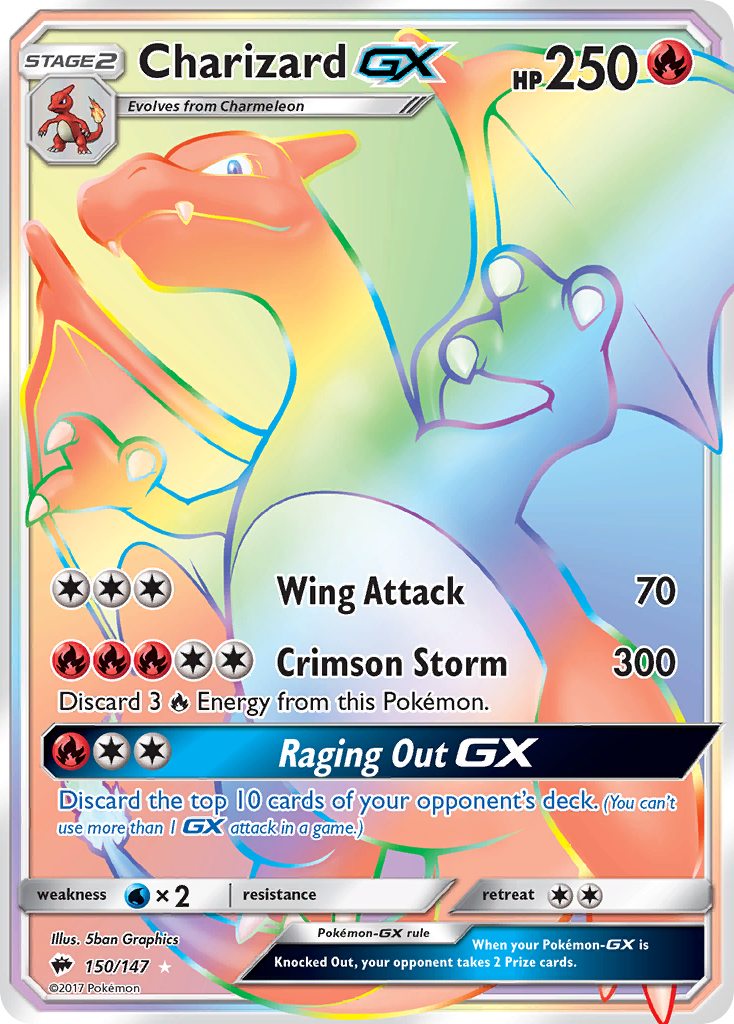
Charizard-GX comes out of Burning Shadows, which I've slotted into the Sun & Moon Era era on Cardboard Assets. That basket has returned +2,029 pp relative to the S&P 500 Total Return across 24 tracked products, with a 41.9% CAGR against SPXTR's 12.8%. Total invested at retail across the era runs roughly $1,837; basket value today is $42,709.
Raw spot sits at $180 per the most recent PriceCharting loose comp. The last documented sale closed at $178 on 2026-05-03, so the market's barely moved since. The trailing 90-day sample is 64 comps, which I'd call robust.
PSA has graded 1,185 copies of this card. The Grade 10 rate is 69.2%, Grade 9 lands 27.0%. PSA 10 / PSA 9 spread is $500, with PSA 10 trading at roughly 2.6× the PSA 9 comp. That's a meaningful but compressed gem premium. CGC has 420 copies on file with a 57.1% Grade 10 rate.
Run those numbers through the optimizer and the verdict is GRADE at PSA. Expected value works out to $661, less raw, less fees, less shipping, gets to a net of $452 per card sent in. ROI is roughly +251% off the $180 raw cost. Most of that EV comes from Grade 10 — that's the bucket I'm effectively betting on when I send this in.
Risk worth flagging: pop counts grow. If grading volume jumps in the next 12 months and the population doubles, the gem-rate denominator gets larger and Grade 10 comps soften. Hard to call where this trends if a major influencer pushes a fresh round of submissions, or if a grader rolls out a service-tier promo that pulls in a wave of marginal copies. My read: the math holds at current pop counts. Watch the 12-month grading volume — that's the lever that reshapes this thesis. For comparable exposure in the same era, look at Latias & Latios-GX, Gengar & Mimikyu-GX. Both sit in the same rarity neighborhood and respond to similar collector dynamics.
Bigger picture: the era basket I'm benchmarking against is dollar-cost-averaged at MSRP across 24 sealed products as they released, then compared head-to-head against the same dollars dropped into the S&P 500 Total Return on the same dates. That's the honest baseline — not a lump-sum-at-inception comparison, which would flatter the cardboard side. Even so, this card's era ran a 41.9% CAGR. Numbers above pull from PSA POP Report, recent eBay sold listings, and PriceCharting loose comps as of 2026-05-04. Coverage expands when our commercial pop-data partner integration completes.
Frequently asked questions
Computed from real comps, pop data, era benchmarks, and the grading optimizer. See PSA 10 sold listings on eBay →
- What is the current price of Charizard-GX?
- The current raw market price for Charizard-GX from Burning Shadows is $482.72. Source: TCGplayer market price via the Pokémon TCG API.
- Is Charizard-GX worth grading?
- Yes — the grading optimizer rates this card GRADE. Projected net profit after grading fees, return shipping, and eBay sales fee is +$300 via PSA. Run the per-grade math at cardboardassets.com/tools/grading-optimizer/?card=sm3-150-charizard-gx.
- Where does Charizard-GX rank in Burning Shadows?
- Charizard-GX is the highest-priced card in Burning Shadows (#1 of 177). Browse the full set with movers, grading opportunities, and era benchmark at cardboardassets.com/sets/pokemon/sm3/.
- Where can I buy Charizard-GX?
- TCGplayer is the highest-liquidity raw-card marketplace. eBay sold-listings filter shows real recent transaction prices (asking prices alone are noise). Both options linked from the card page.